
Colours of the donut
Edited
The colours of the donut represent the different sources of attention:
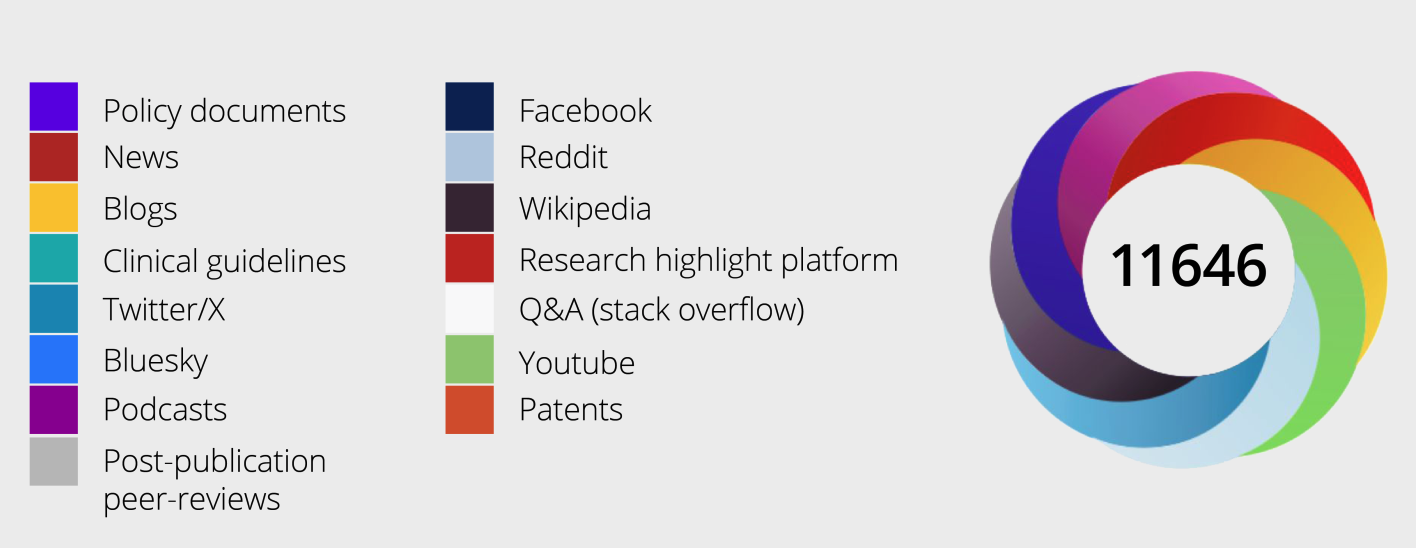
The amount of each colour displayed on the donut will change depending on which sources a research output has received attention from. For example, if a research output only received attention from X (formerly Twitter), the donut will be completely light blue:

And if a research output received attention from news outlets as well as a few X posts, the donut will appear red with some light blue: