Introduction to the Details Page
The Altmetric Details Page aggregates all of the online attention associated with a research output.
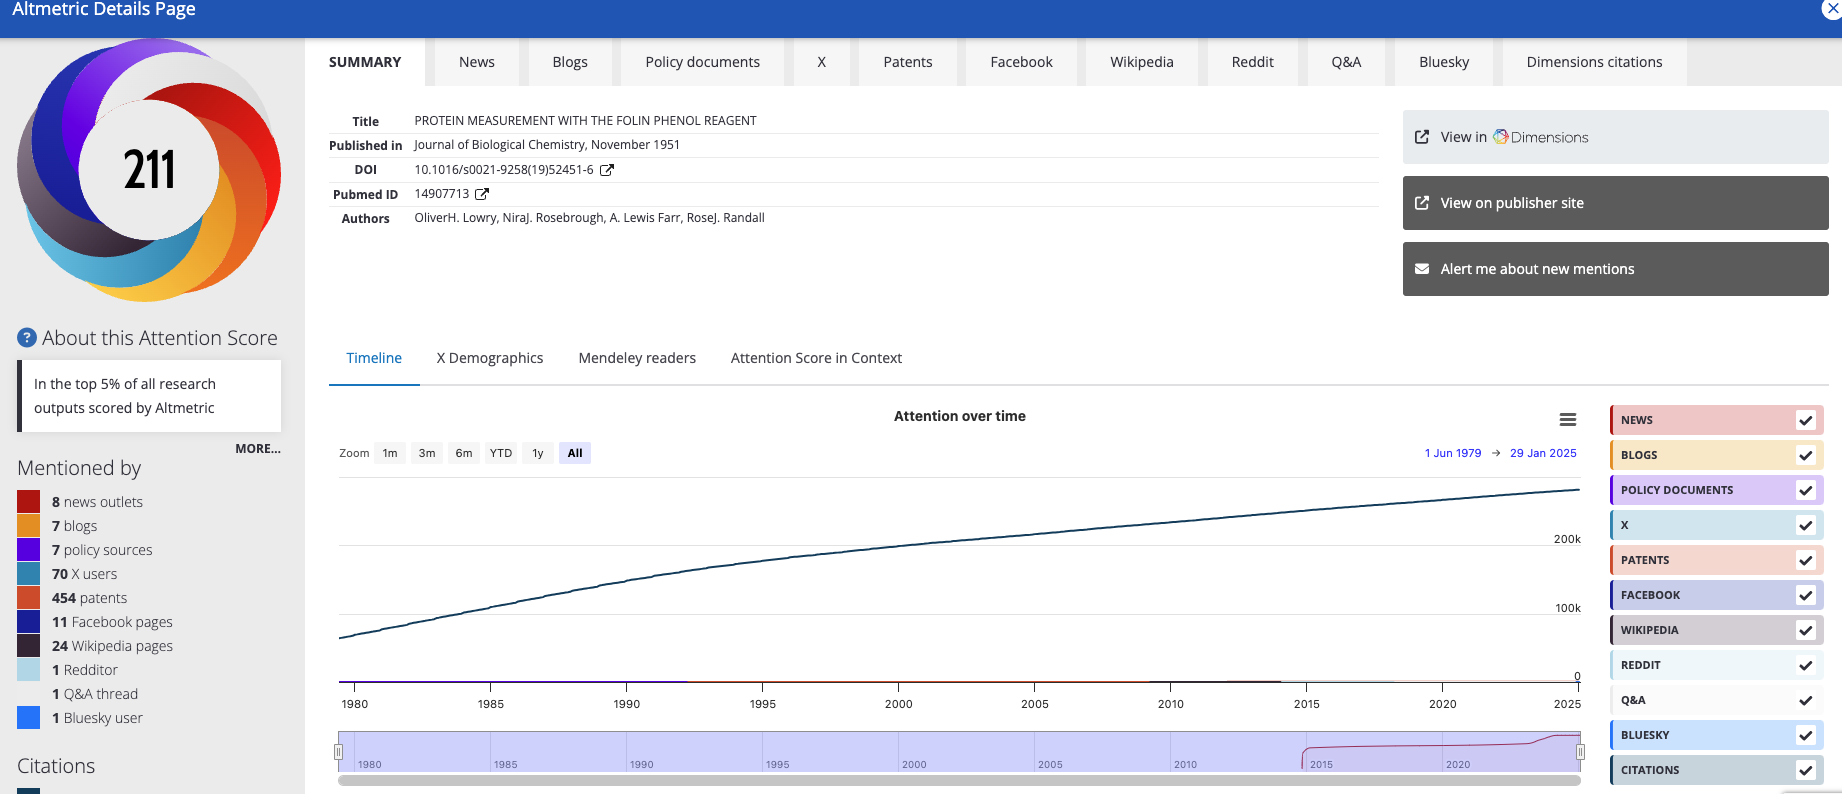
On the details page you'll find different components.
The Badge (donut) and the Score
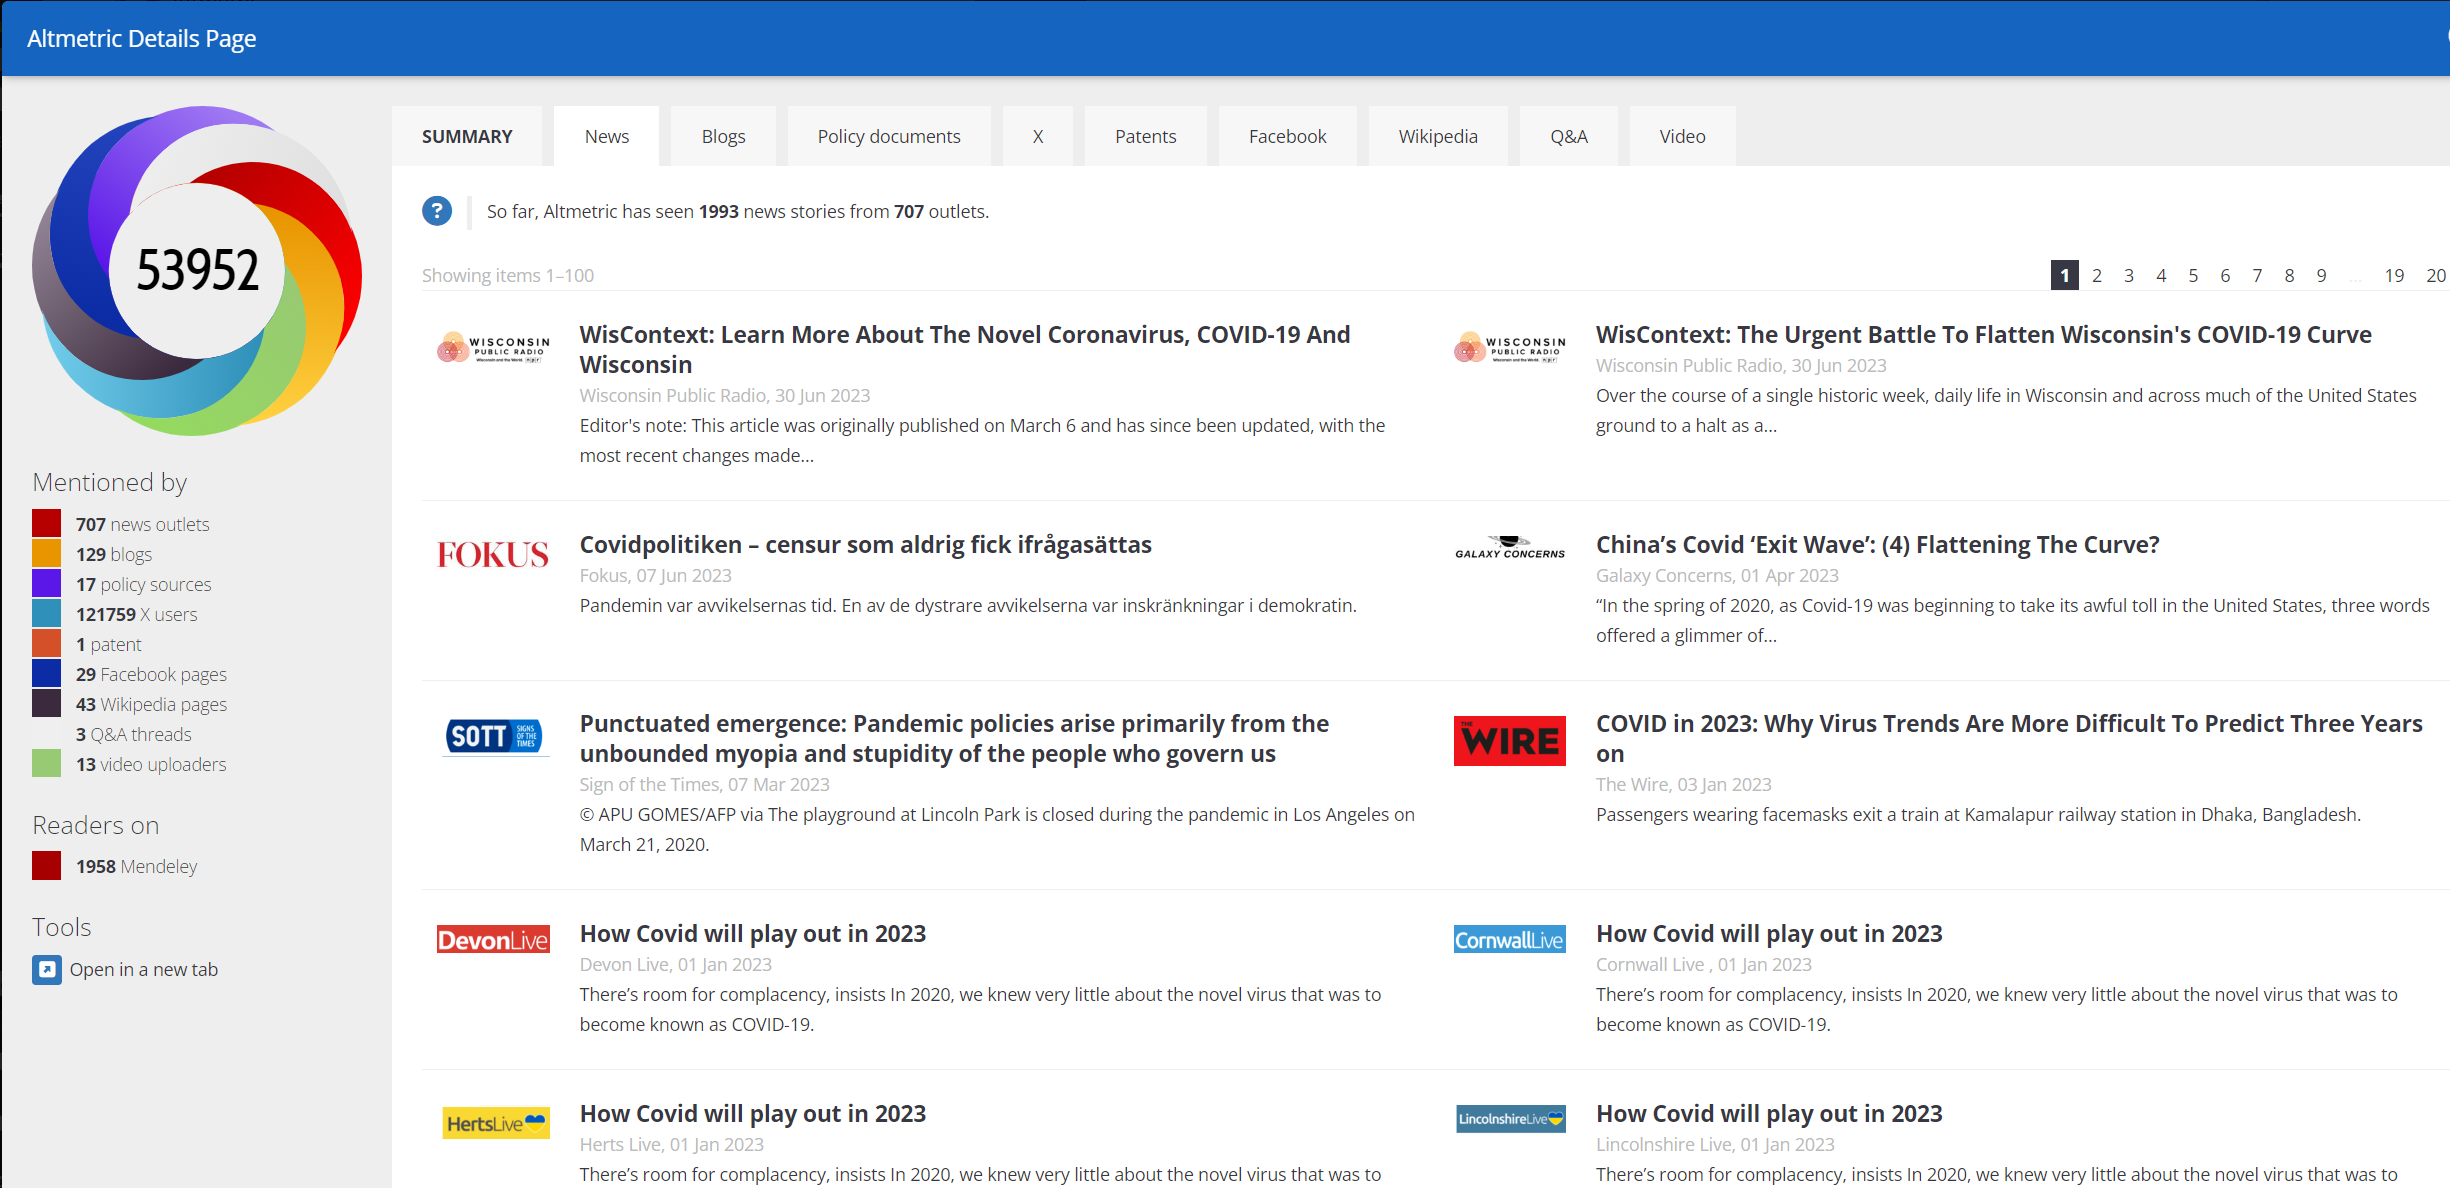
On the left-hand side the Altmetric donut contains the Altmetric Attention Score. The donut itself is made up of different colours, which represent different types of attention for the output. The more colours appear in the donut the more types of outputs have recorded attention about the output.
Mentioned by and Readers on
This list provides a snapshot of the current attention associated with the output. It shows the number of mentions or readers for every type of attention that has been received so far.
The Summary tab
The summary tab contains general information regarding the paper. The title, where it was published, its publication date, the identifier associated with the output (DOI, Pubmed ID, ISBN etc.), and the author(s)' name(s).
The Timeline section
The Timeline section allows you to explore how attention for a research output has accumulated and evolved over time. It features two dedicated sub-tabs: Attention over time and Attention score history. Each offers a unique visualization of the output's attention data.
The charts share the following interactive features:
Zoom: Focus on specific time ranges using the preset zoom buttons (1 month, 3 months, 6 months, YTD, 1 year, All).
Navigator Bar: Use the scrolling bar at the bottom of the charts to slide through full historical date ranges.
Tooltips: Hover over individual data points to view specific data at an exact moment in time.
Export: Download each chart as a PNG image, or download the underlying dataset as a CSV file.
These charts are only available to Altmetric Explorer and Altmetric Bookmarklet users, and are not available on Details Pages with limited view.
Attention over time
This tab contains a visual representation of the attention the output has accrued over time. On this chart, you’ll see separate trend lines for all of the different sources that have generated attention for the research output.
You can click on any of the data points to be able to see the mentions for that specific source filtered to the appropriate timeframe in Altmetric Explorer.
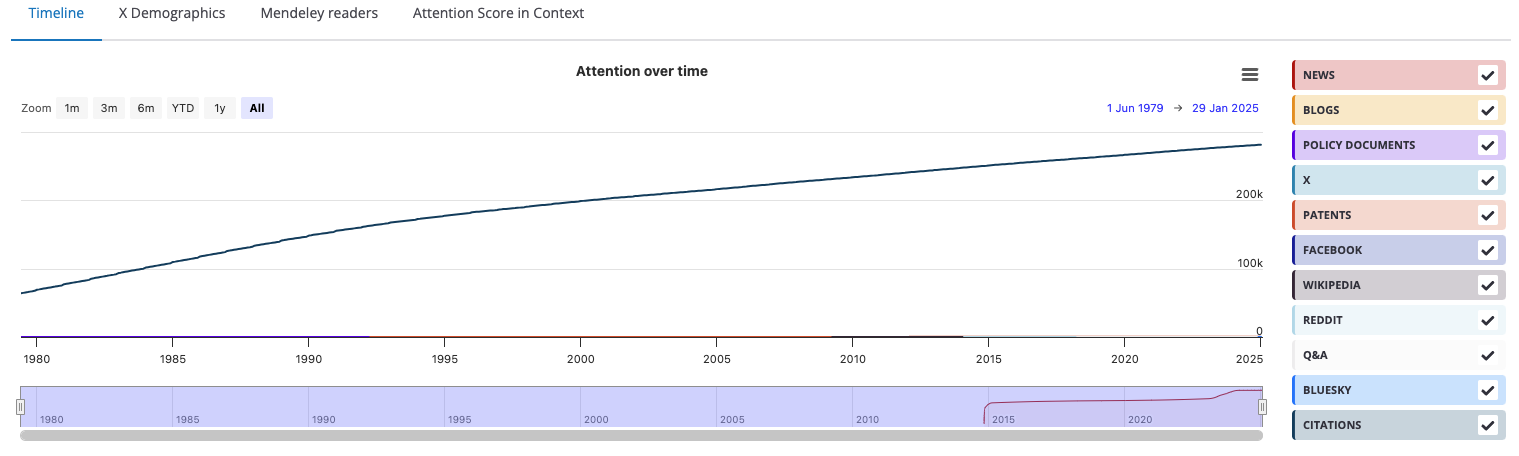
The Timeline also gives you information about Dimensions citations received for this publication, allowing you to interact with Altmetric and Dimensions data simultaneously. In addition, you can view the Dimensions’ publication detail page by clicking on the "View in Dimensions" button, at the top of the page.
Attention Score history
This tab maps out the output's overall Altmetric Attention Score at every recorded change. Instead of counting individual mentions, this single line shows you exactly how the composite score grew, spiked or plateaued
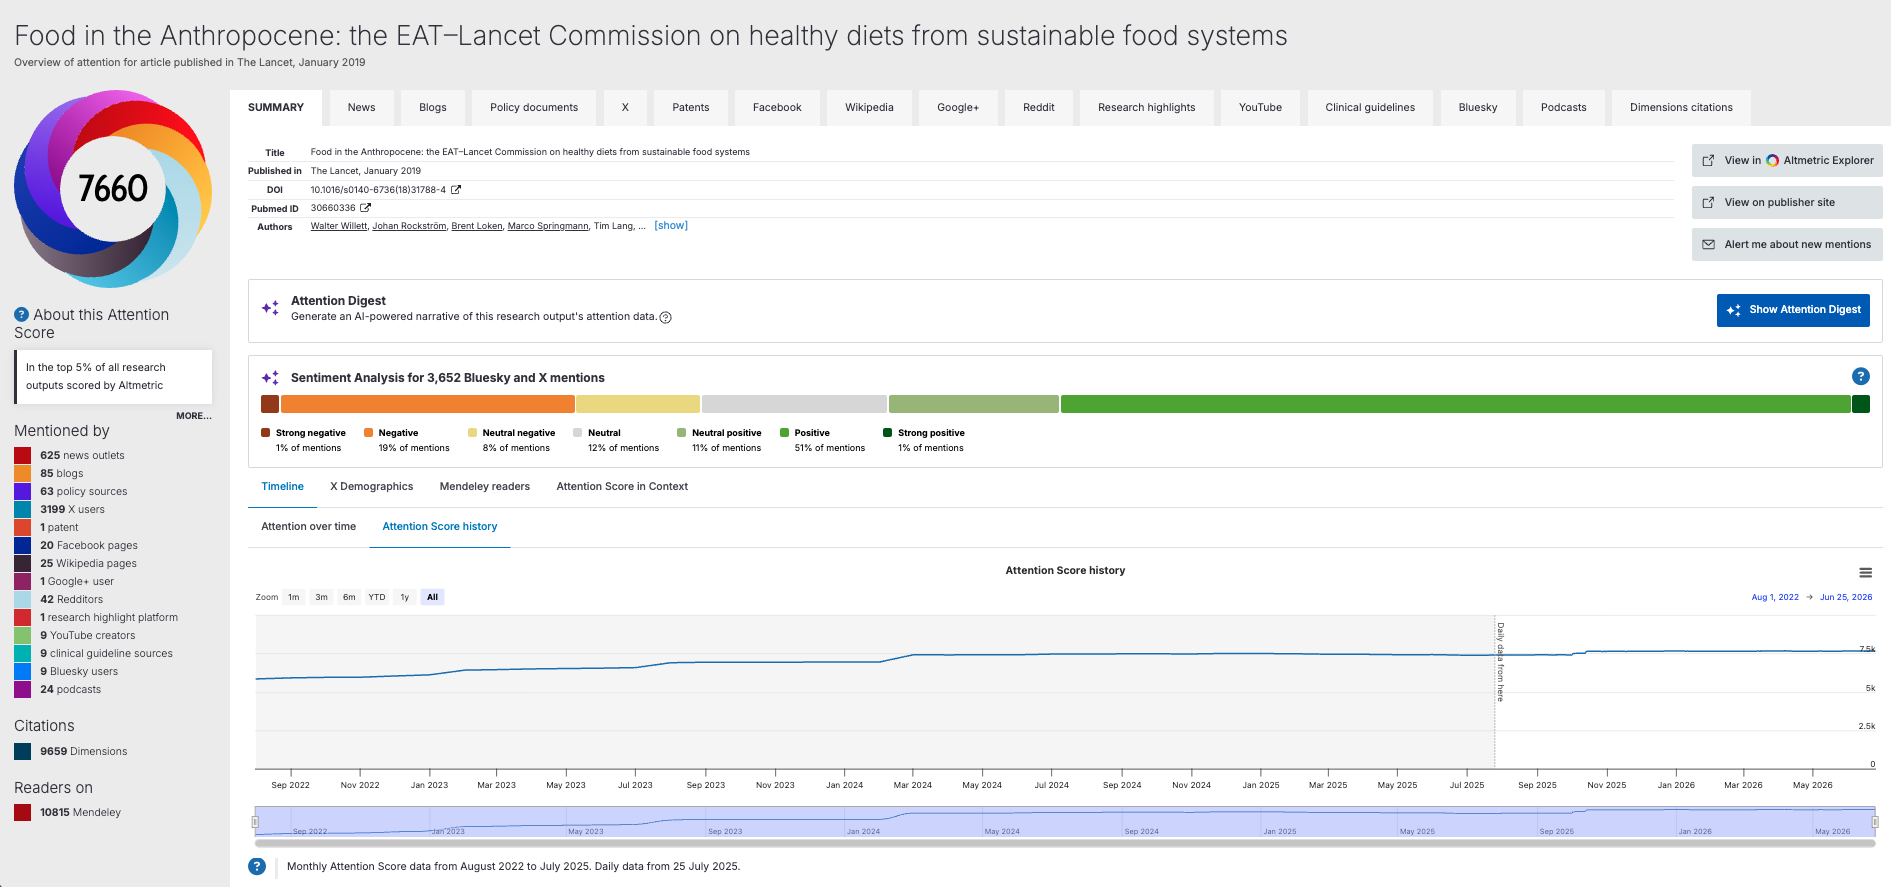
The chart relies on historical snapshots and live tracking data. Because Altmetric began systematically capturing historical score data on August 1, 2022, score history data is not available before this date.
August 1, 2022 – July 25, 2025: Data is presented as monthly snapshots.
NOTE: monthly snapshot data before 25 July 2025 is only available for outputs that are also tracked in Dimensions.
July 25, 2025 onwards: Data is tracked on a daily basis.
Interactive tooltips are generated only when a score change is actively recorded. If the score remains unchanged between two dates, no tooltips will appear for that period. The line will simply connect the two points of change, indicating a period of stable attention.
Where a specific output’s chart begins depends on when the research output first accumulated attention:
Outputs with attention before August 2022: The chart will begin with the score recorded in August 2022.
Outputs with attention after August 2022: The chart will begin on the specific day the output's score first crossed into a positive number (either during a monthly snapshot or via daily tracking, depending on the date).
Outputs with stable scores: If an output’s score has remained completely unchanged since the first recorded score, the chart will display as a single, flat horizontal line.
Note: the score shown on the chart is updated regularly and may lag briefly behind the live score displayed on this page. Both scores are correct; they simply pull from data pipelines that refresh at slightly different intervals. Instances where the chart shows a decrease in an output’s Altmetric Attention Score are usually due to one or more of the factors described in this article.
Additional sections on the Summary tab
Activity: shows the historical trend behind an output's Mendeley reader count, so you can see whether readership grew steadily, spiked, or plateaued over time. You can read more about this in Mendeley.
X demographics: a map showing the location of X users who have shared the output.
Mendeley Readers: a geographic and demographic breakdown of the readers who have the output in their Mendeley library (by country, subject area, and professional status).
Score in Context: shows how this output's Altmetric Attention Score compares to other outputs, such as those published in the same journal, of a similar age, or both. You can read more about this in Putting the Altmetric Attention Score in context.
Attention specific tabs
Each type of attention has its own tab. The tab is created once attention has been seen. The mentions are sorted by time, with the most recent mention being at the top.
Finding a Details Page
The details page is accessible by clicking on the badges associated with the paper. These badges will appear on the publisher's webpage or within the bookmarklet.
You can set up email alerts to tell you when an article has been mentioned by clicking on the "alert me when this output is mentioned" button on the details page. This allows users to track the ongoing attention associated with a research output. Whether it is that of a researcher, or simply an item of interest, anyone can stay up to date on any output tracked by Altmetric.
If an article hasn't been mentioned, it will still have a details page if it has mentions, such as Mendeley readers, that don't count towards the overall attention score a details page without additional tabs will be created.
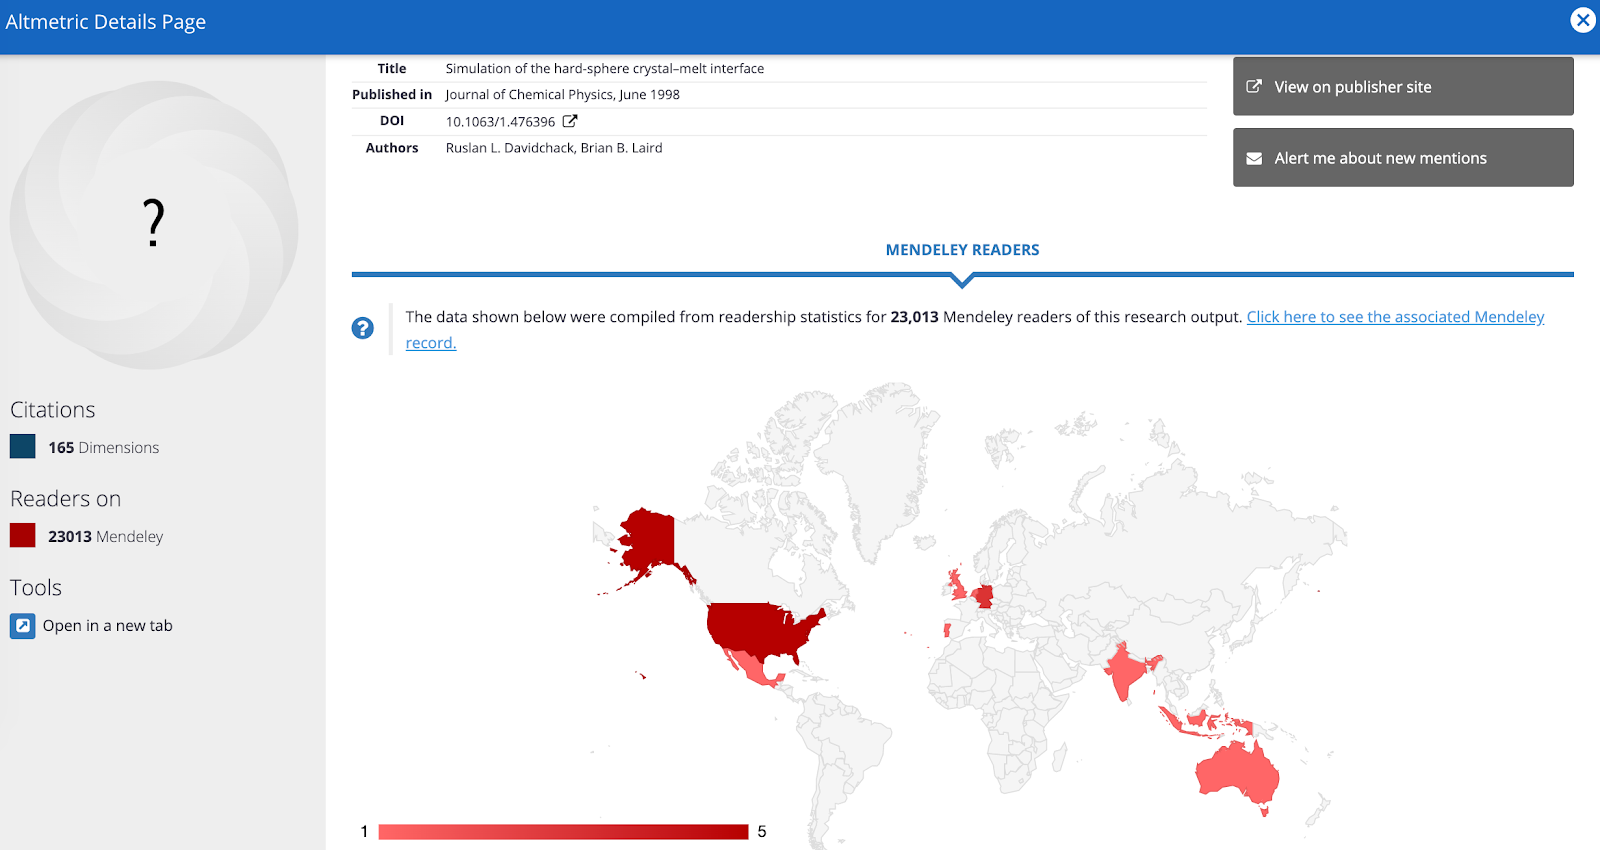
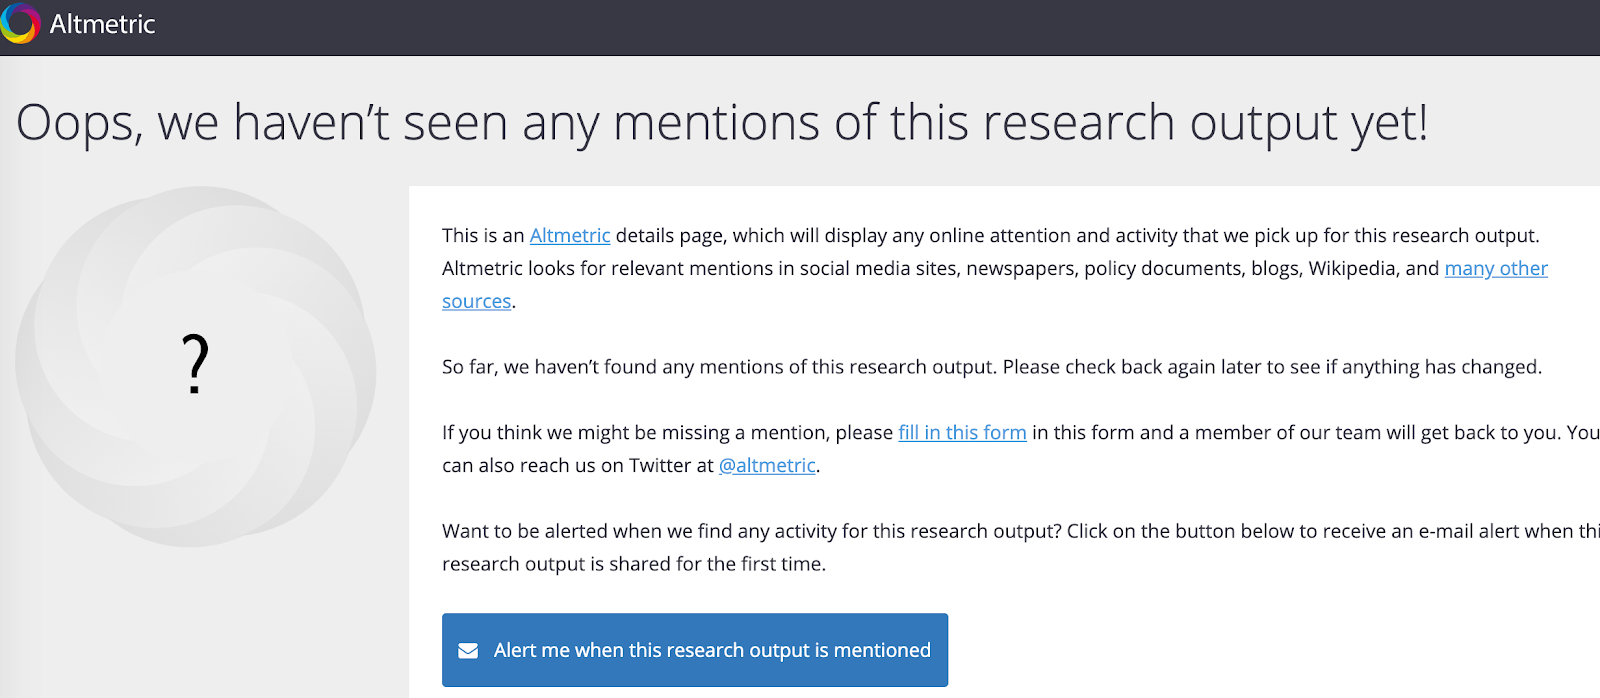
If the article hasn't been mentioned at all, it will be represented by a different type of page. This page shows no summary tab, though it does still provide the option to be alerted to new mentions.